Analysis


|
Analysis |
|
|
Analysis is a reporting tool in which you can analyze, monitor, report and combine information. With this functionality, you will find your tax expense data in a centralized and organized data store. You can justify the results of your data, address questions about their data and strategically plan for the future with "real time" reporting. In Analysis, you can choose Dashboards and Reports containing metadata (data that provides information about other data from the ONESOURCE Tax Provision database) for reporting. A license is required to activate the Analysis functionality within the Tax Provision and Global Access applications.
There are two types of licenses available for the Analysis functionality; End Users and Designers. You must activate a license to see Analysis in the navigator menu.
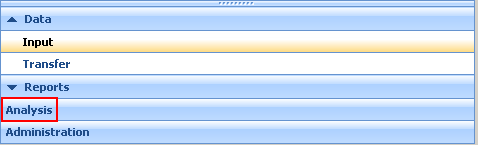
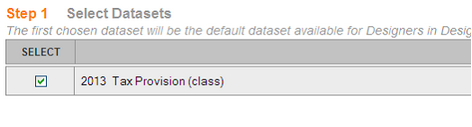
Note: Administrators assign datasets to Analysis in the Analysis Datasets folder within ONESOURCE Tax Provision Administration. To access the Analysis page:
Note: The datasets size is determined by how much data is stored in that dataset. A dataset may have a size of 1 or higher. You can select datasets up to the total size of 40 and view that data in the dashboard and reports.
|