Dashboard


|
Dashboard |
|
|
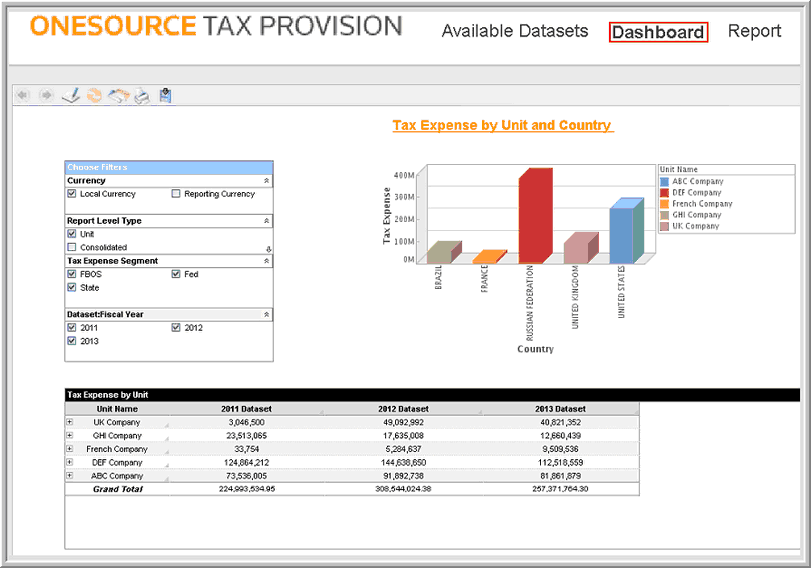
In Analysis, "Dashboards" provide a way to visualize data. Dashboards are created by the "Designer" and then assigned to End Users. Users can view dashboards in the Dashboard page. If multiple dashboards are available, they appear in the list of tabs at the bottom of the page.
To open a Dashboard:
Note: If a "Designer" did not create and assign a dashboard to the "Dashboard," by default the Report page opens. In the report page, End Users can see the Repository list and find "assigned" reports within the Shared Analysis folder. A "Designer" must create and assign reports, to the reports page, in order for them to appear in the reports page. |